
Event Analysis
Under the "Events" tab, users have the option to view an event analysis by clicking on the "See Event Chart" button. This will redirect them to the charts page, which provides two insightful visualizations:
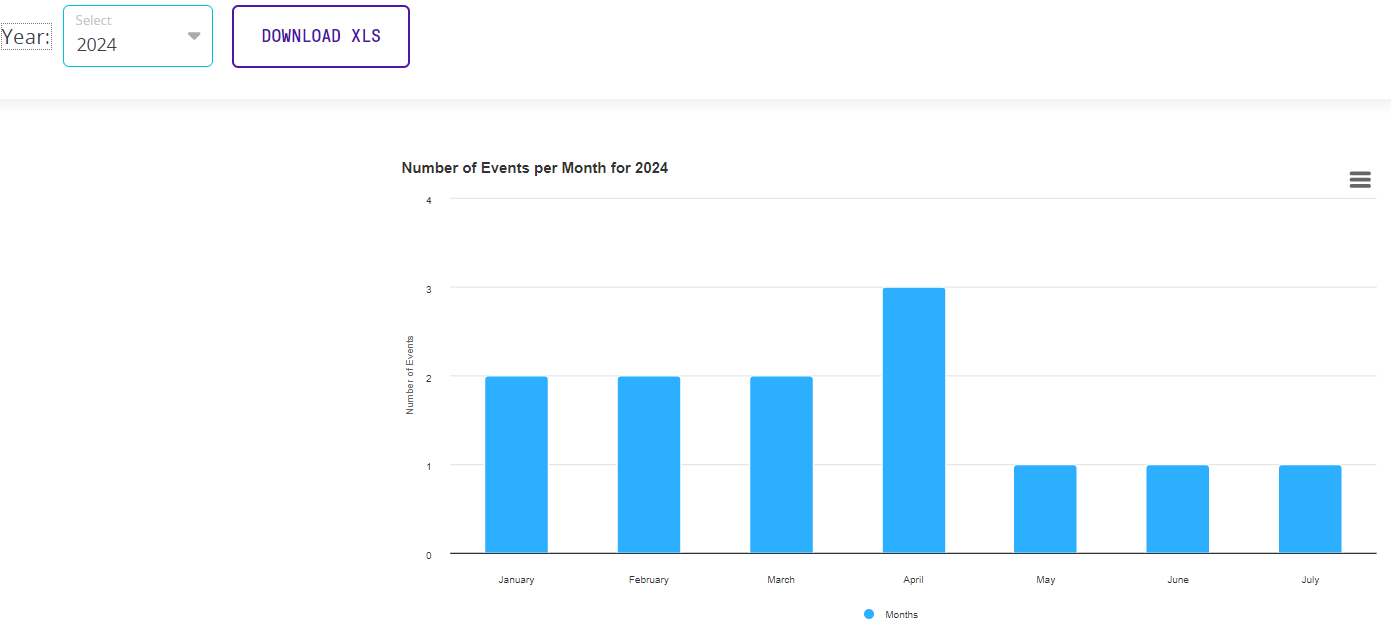
- Monthly Events Chart: This chart displays the number of events for each month within a selected year.
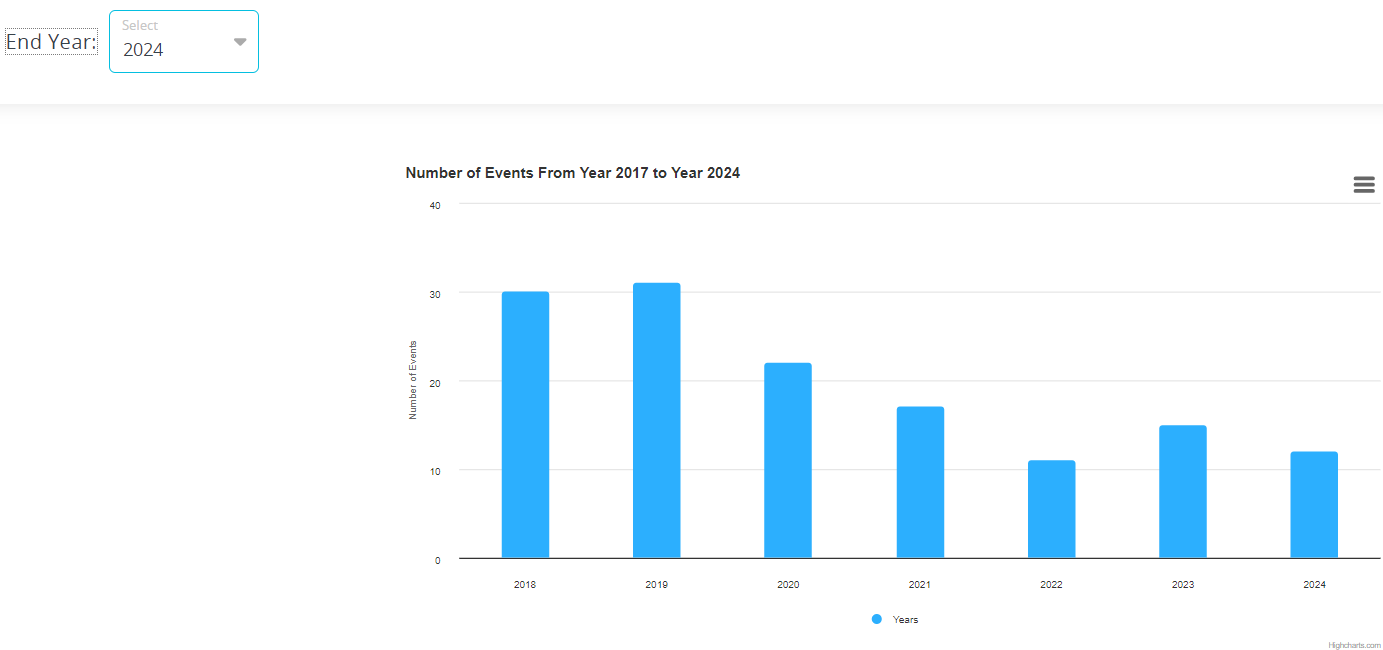
- Yearly Events Chart: This chart shows the number of events per year over a specified range of years
Additionally, a "Download XLS" button is available on the charts page, allowing users to download all the analysis data in an Excel spreadsheet for further review and analysis.
These features enable users to easily analyze event trends over different periods and conveniently access the data in a downloadable format.

